Data Visualization
Exploring different ways of understanding and representing data.Information Design, Data Visualization
Tools: Microsoft Excel, Illustrator, Tableau, MapBox, JavaScript, Processing
Year: 2021
Tools: Microsoft Excel, Illustrator, Tableau, MapBox, JavaScript, Processing
Year: 2021
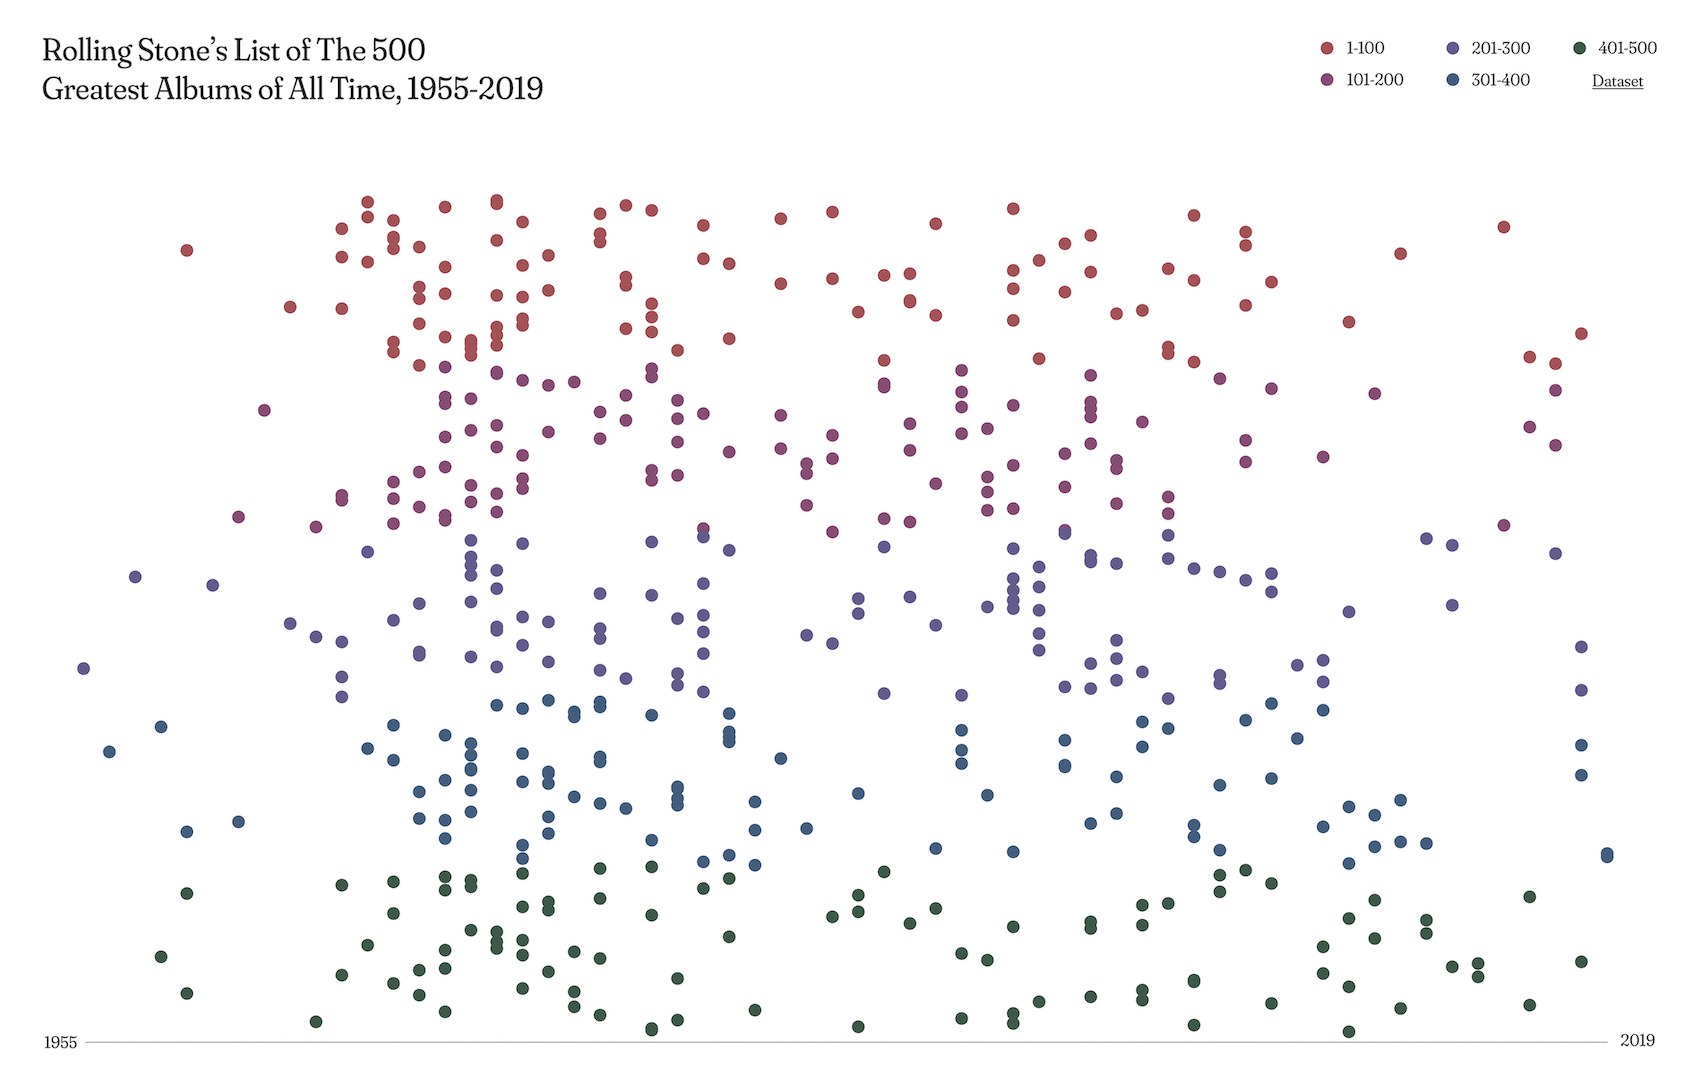
500 Greatest Albums of All Time
To create this piece, I worked with a dataset on Rolling Stone’s list of the 500 Greatest Albums of All Time from 1955-2019. Within the visualization, seen as a timeline, each dot represents an album, with the variations in color defining which spot on the list each album is in. I developed the visualization, including the scale and color, in Processing. Title, legend, and timeline added in Illustrator.

Data Portraits
For this class project, I collected and visualized personal data in Adobe Illustrator. As my focus, I chose the daily to-do lists I create every morning and developed a methodology for representing this information. The forms are inspired by the concept of striving to balance work, activities, and moments with friends and family throughout the day, as well as from the idea of books stacked on top of one another.
![]()

Paper-based, sculptural data portrait – printed design created in Processing using data I collected on my daily habits. (2018)
![]()
